Proteoglycans (PGs) and their glycosaminoglycan (GAG) chains play a prominent role in a biological system. PGs are among the most structurally complex of the glycoconjugates and are involved in signaling and cell-cell interaction. PGs contain a core protein to which one or more glycosaminoglycan chain is attached through an O-glycosidic linkage to specific serine residues in the core protein. Due to their complex and diverse structures, a major limitation has been the lack of the advanced analytical platforms for complex glycans. Decades of analytical and biochemical research have led to the routine sequencing and analysis of nucleic acids and proteins in both academic and clinical laboratories using highly sensitive analytical platforms. However, the development of similar platform technologies in glycoscience is at least 20 years behind nucleic acid and protein science. Dr. Linhardt’s laboratory was the first to apply a number of sophisticated analytical methods, including high-resolution electrophoresis, nuclear magnetic resonance (NMR) spectroscopy and mass spectrometry, developed for nucleic acid and protein analysis, to the structure analysis of GAGs.
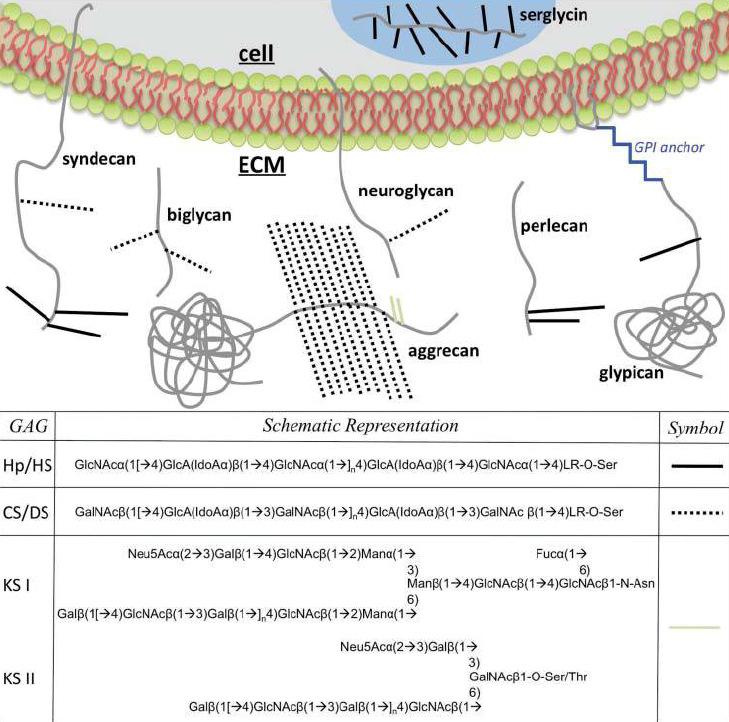
Figure 1. Various proteoglycans embedded in the cell membrane or free floating in the ECM are shown.
For structural analysis, recombinant heparin lyases are used to break the glycosaminoglycan chains into disaccharide/oligosaccharides. Different disaccharides/oligosaccharides can be separated by LC/CE and detected MS/LIF. Their structures can be solved using sophisticated NMR and MS/MS analysis. New MS methods include FT-ICR-MS, with CID, ECD and EDD based fragmentation methods.
Using a combination of separation and high-resolution mass spectrometric methods, for the first time, we can sequence the simplest glycosaminoglycan chains from bikunin (results were published in Nature Chemical Biology, Oct, 2011).
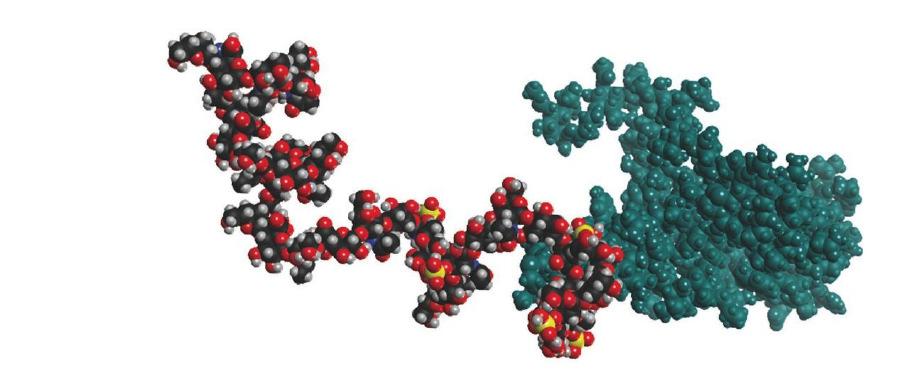
Figure 2. A space filling model of bikunin, the simplest proteoglycan is shown. The core protein is shown in blue and the linear glycosaminoglycan chain is shown in multi-color. The sulfurs of the sulfo groups are shown in yellow.
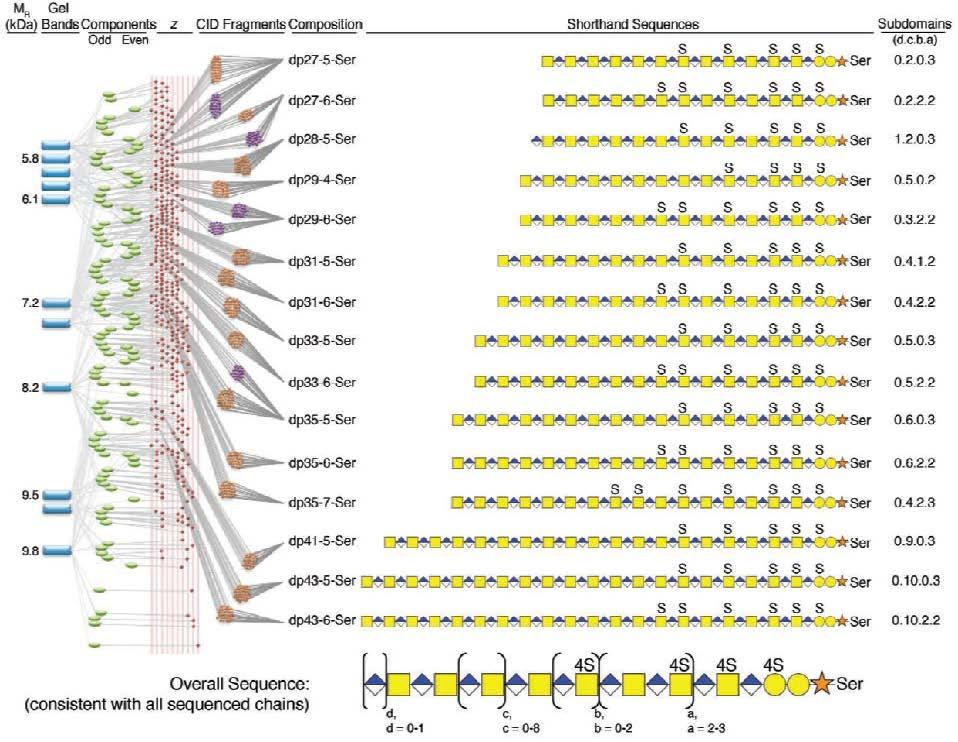
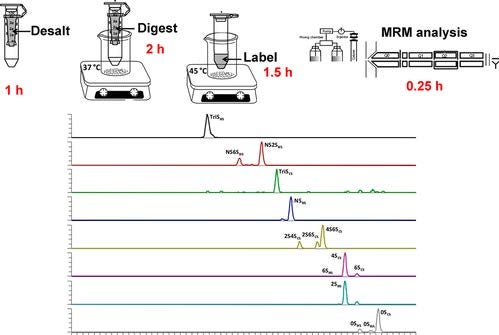
Figure 3. Bikunin sequencing flow chart (From left to right). The MR (kDa) determined based on PAGE of fractions (blue rectangles represent gel bands) of bikunin in pG prepared by continuous elution PAGE is shown. The deconvoluted MS obtained using FT-ICR-MS affords the mass of 3-5 odd and even components (green ovals) observed in each bikunin pG fraction is shown. Each MS spectrum showed multiple change states (z-values) shown as red diamonds from which parent-ions were selected for MS/MS giving CID fragments by analysis on FT (purple circles) or FT-ICR (brown circles). The composition is designated dp and sulfo group 26 number (i.e., dp 27-5-Ser is 27 saccharide units with 5-sulfo groups O-glycosidically linked to a Ser residue). A shorthand sequence for each chain is shown with a, b, c and d subdomain repeats indicated by numbers (i.e., 0.2.0.3 for d = 0, c = 2, b = 0, a = 3).

Figure 4. FTICR-MS analysis of a bikunin pG fraction. a. FTICR negative-ion mass spectrum of 5.80 kDa MR fraction by PAGE with 18 isobars and 63 parent-ions; b. Deconvolution of spectrum a; c. CID FT-ICRMS/MS spectra of parent-ion m/z=917.38(z=6) and annotated fragment- ions providing sequence with dp27-5-Ser fragmentation pattern assigned from spectrum.
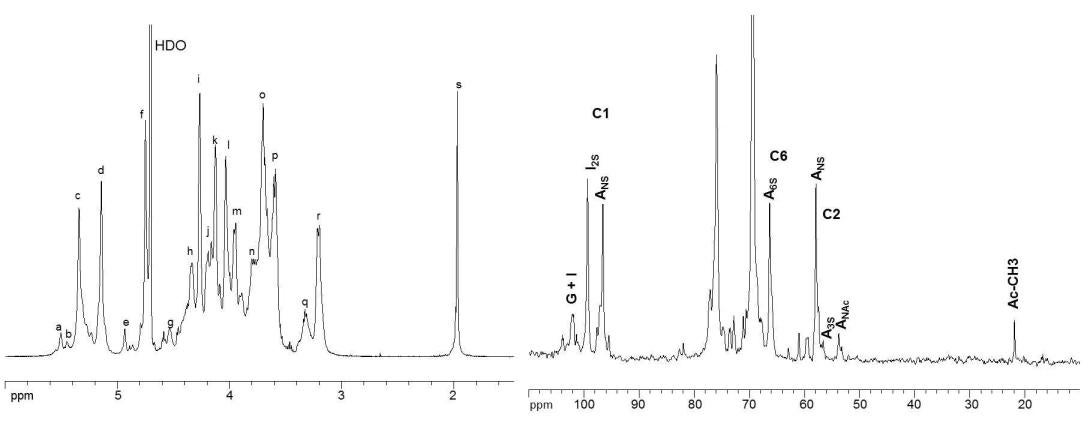
Figure 5. 1H-NMR and 13C-NMR spectra of heparin polysaccharide. The spectra were acquired at 600 MHz on a Bruker Avance Ultrashield 600 MHz (14.1-Tesla) NMR instrument. Peak assignments for proton spectrum: (a) H1 ANS-(G); (b) H1 A3S; (c) H1 ANS6x; (d) H1 I2S; (e) H1 I; (f) H5 I2S; (g) H1 G; (h) H6 ANS6S; (i) H2 I2S; (j) H6’ ANS6S; (k) H3 I2S; (l) H4 I2S; (m) H5 ANS6S; (n) H6 ANS; (o) H4 ANS6S; (p) H3 ANS6x; (q) H2 G, H2 A3S; (r) H2 ANS6x; (s) acetyl CH3 (A, Glucosamine; I, Iduronic acid; G, Glucuronic acid).
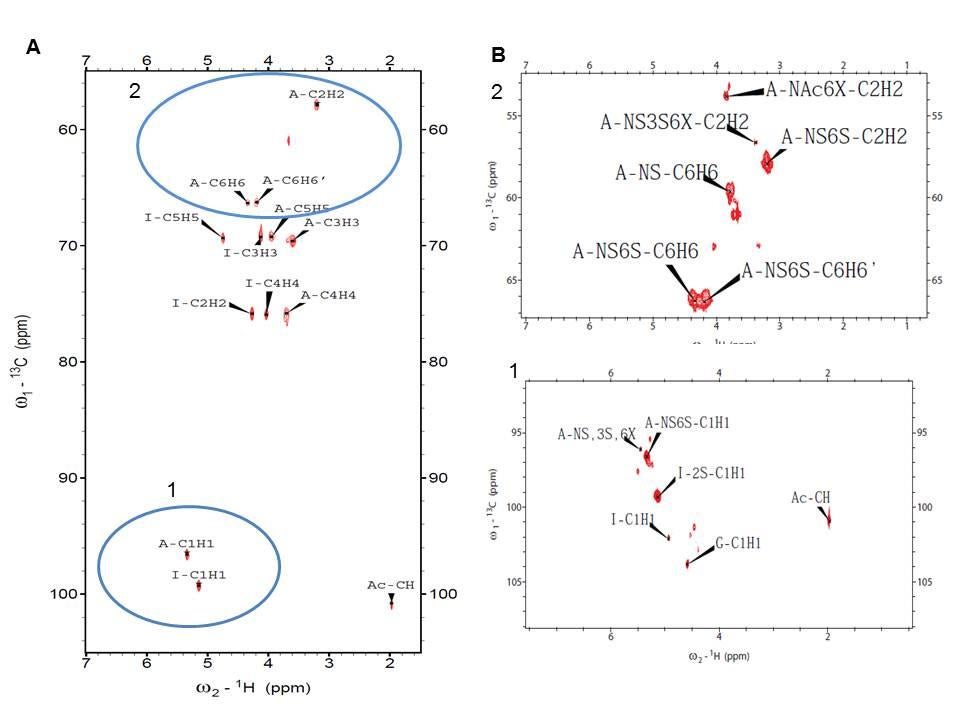
Figure 6. Twodimensional 1H-13C HMQC spectrum of heparin polysaccharide. (A) Entire HMQC spectrum, (B) the selected regions of the spectrum. Blue circles 1 and 2 indicate anomeric region and H2/C2- H6/C6 glucosamine resonances, respectively.
Glycosaminoglycans (GAGs) are functionally important in the developmental biology of multicellular organisms and their local concentrations in a healthy organism are well regulated. While the determination of GAGs, present at low concentrations, in biological fluids poses a difficult challenge. Dr. Linhardt’s laboratory developed a rapid and sensitive method by liquid chromatography−tandem mass spectrometry to efficiently determine low concentrations of glycosaminoglycans in human urine. This method allows the analysis of glycosaminoglycan content and disaccharide composition in urine samples having concentrations 10- to 100- fold lower than those typically analyzed from patients with metabolic diseases, such as mucopolysaccharidosis. The current study offers a method that is sufficiently sensitive to study changes in urinary GAG levels and compositions resulting from diseases outside of MPS such as inflammatory reactions and cancers.
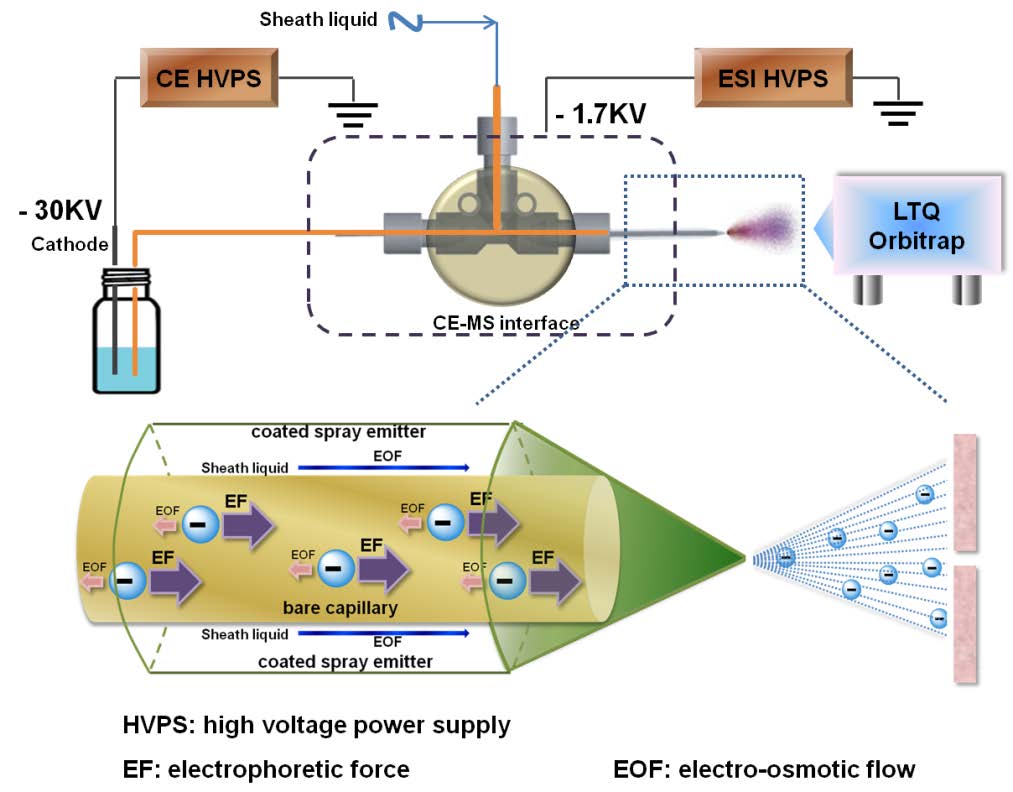
Heparin, a widely used clinical anticoagulant, its analysis has become increasingly important since the contamination of the heparin supply chain in 2007-8. In recent years, Heparin-based drug products are becoming more dependent on mass spectrometry (MS) for high sensitivity, high-throughput analyses. Electrophoresis, offering extremely high-resolution separations, is particularly ideal for online coupling to MS. However, the negative-mode CE–MS interface, which is suitable and applicable to online analysis of negatively charged heparins, remains a major technical challenge. Dr. Linhardt’s group established a novel hyphenated CE-MS method relying on a reverse polarity separation with the analyte injected at the cathode and a coated sheath capillary interface to promote the electrokinetic pumping of negatively charged heparin oligosaccharides for MS analysis. The application of this CE-MS method to ultralow molecular heparin suggests that a charge state distribution and the low level of sulfate group loss that is achieved make this method useful for online tandem MS analysis of heparins.